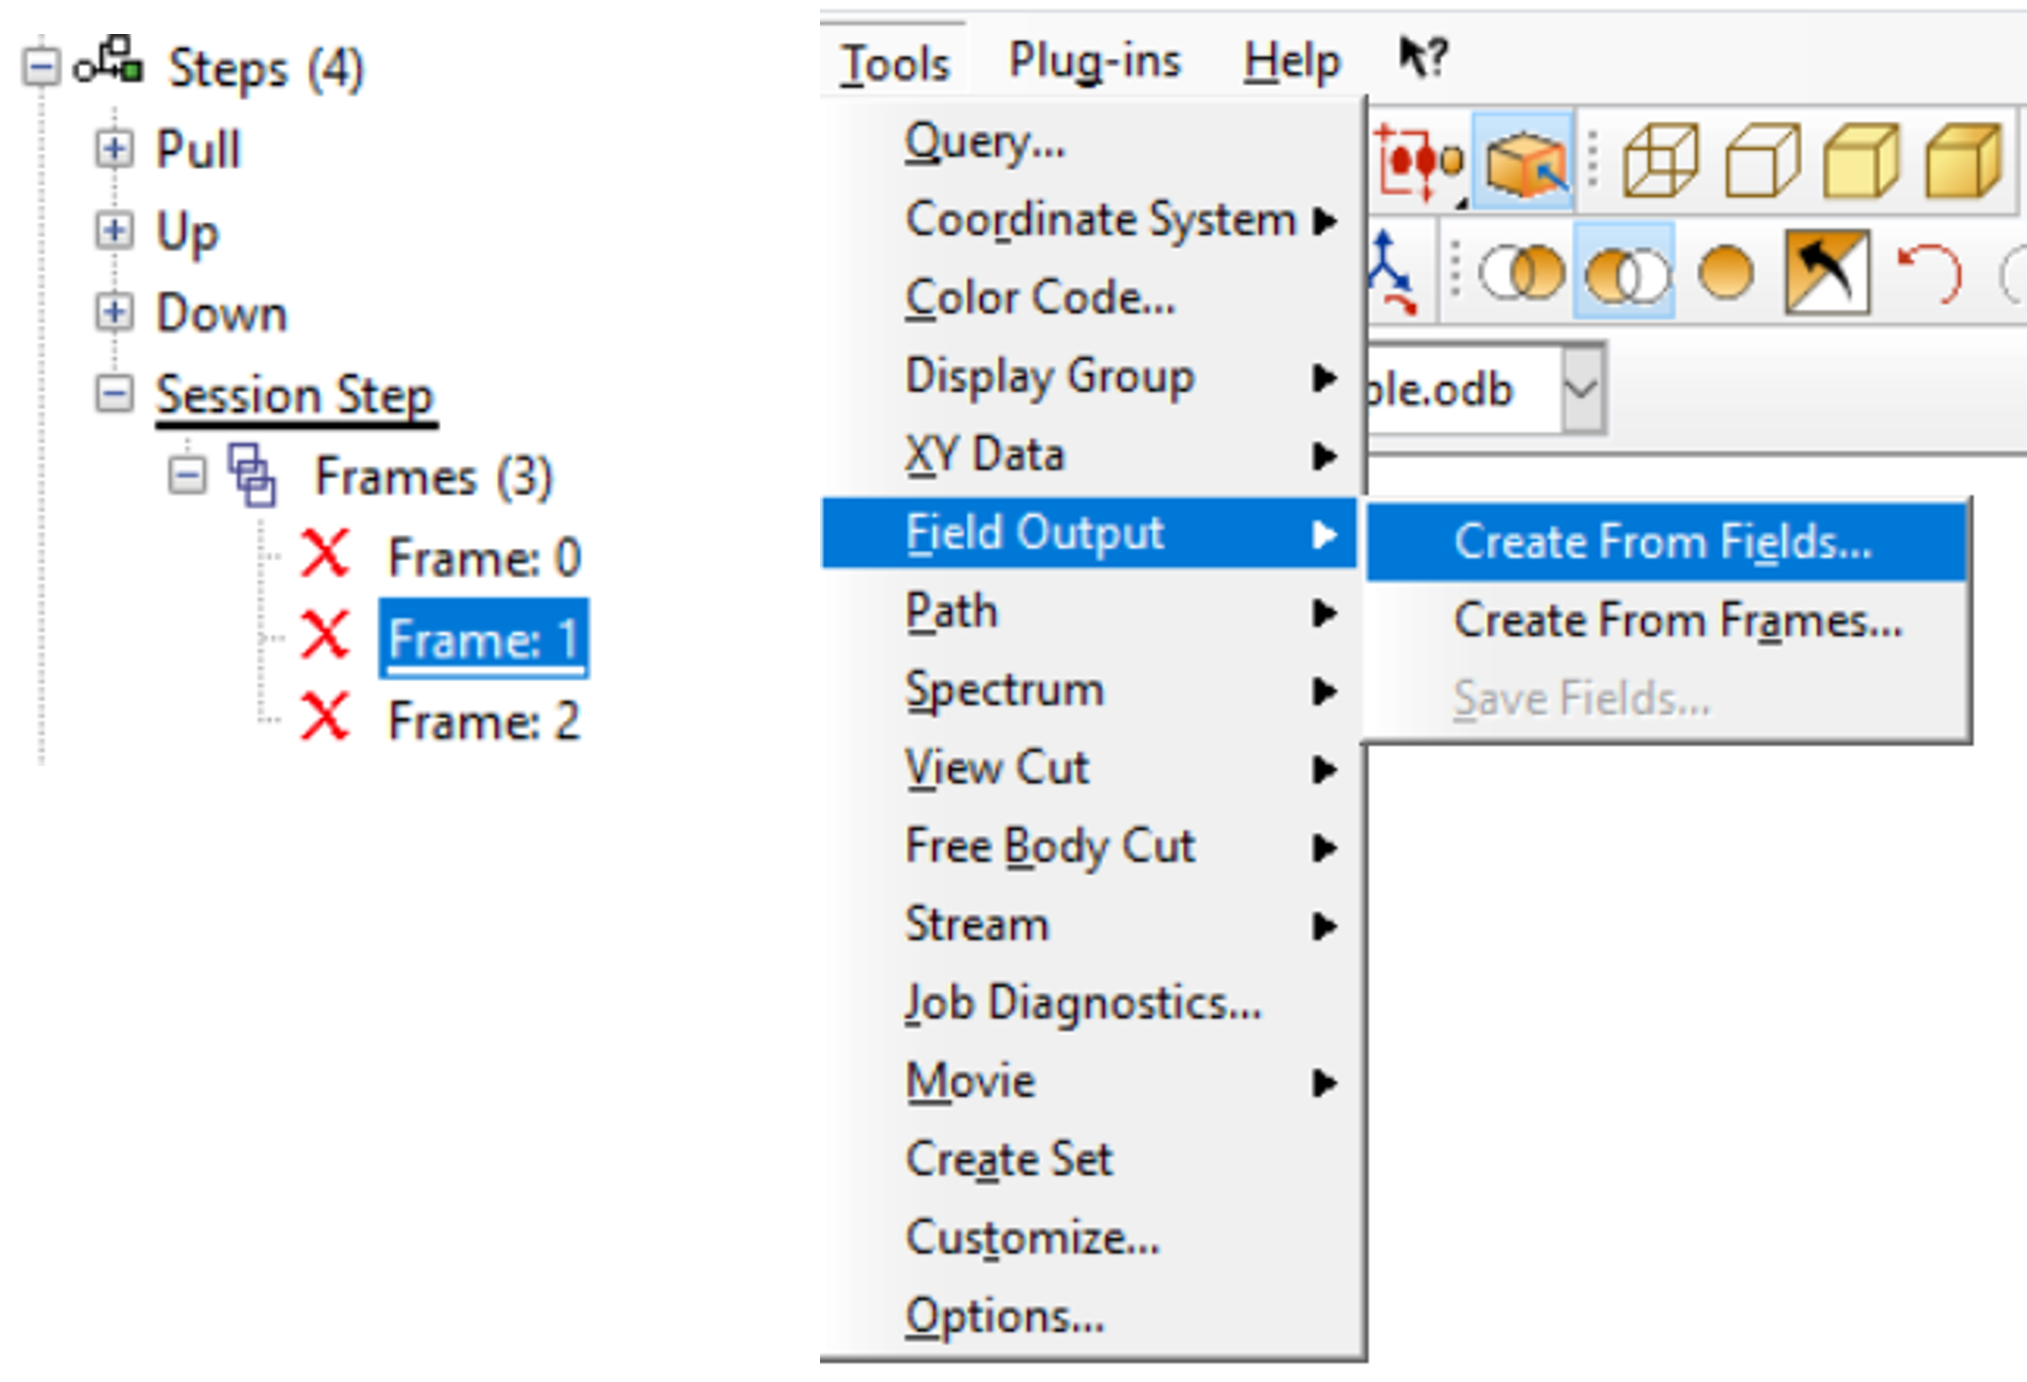
In Abaqus/CAE Module Visualization or in Abaqus/Viewer, FIELD outputs, such as stresses and strains, are output in frames. Here, frames stand for time points or individual frequencies, for example. Now, there is a possibility to use the values of different frames to calculate new outputs.
An example to better estimate the fatigue strength of a component will explain the procedure. However, it is not a general procedure for fatigue strength verification.
Three independent load cases (PERTURBATION Steps) are considered:
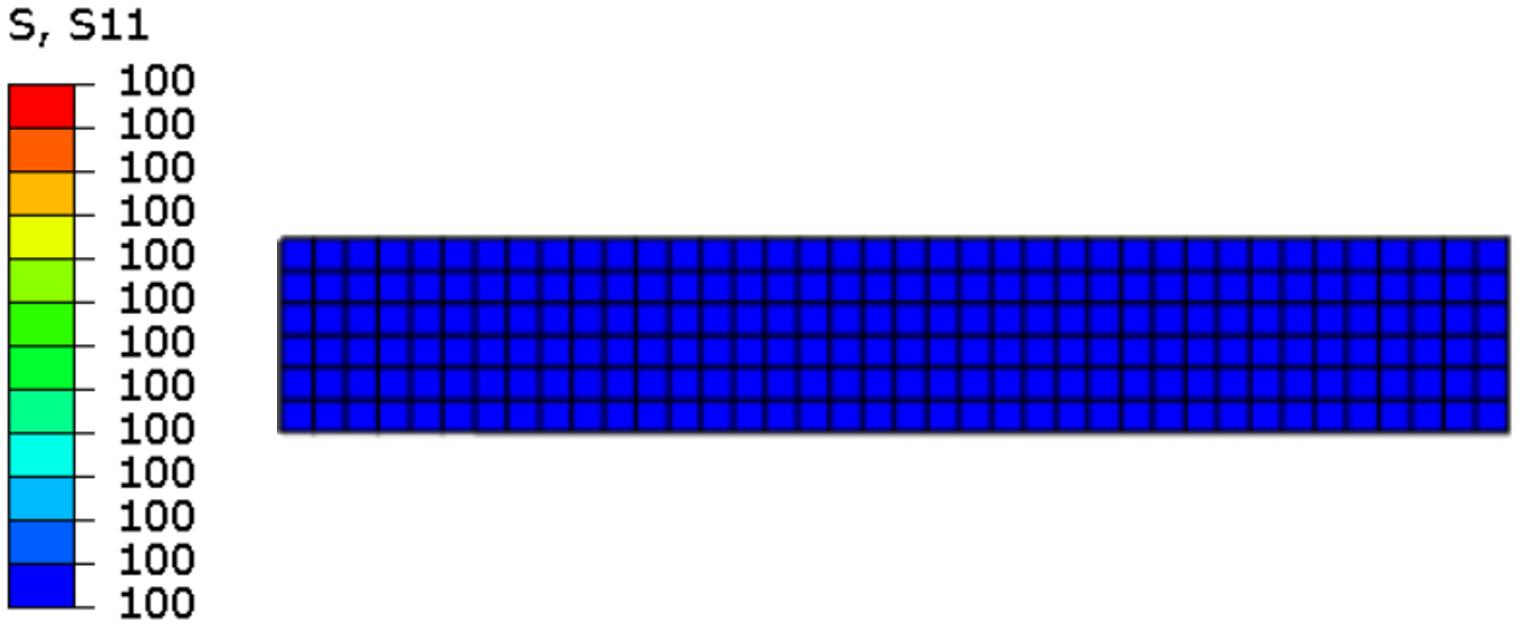
Step 1 : Tension load -> 100 MPa tensile stress
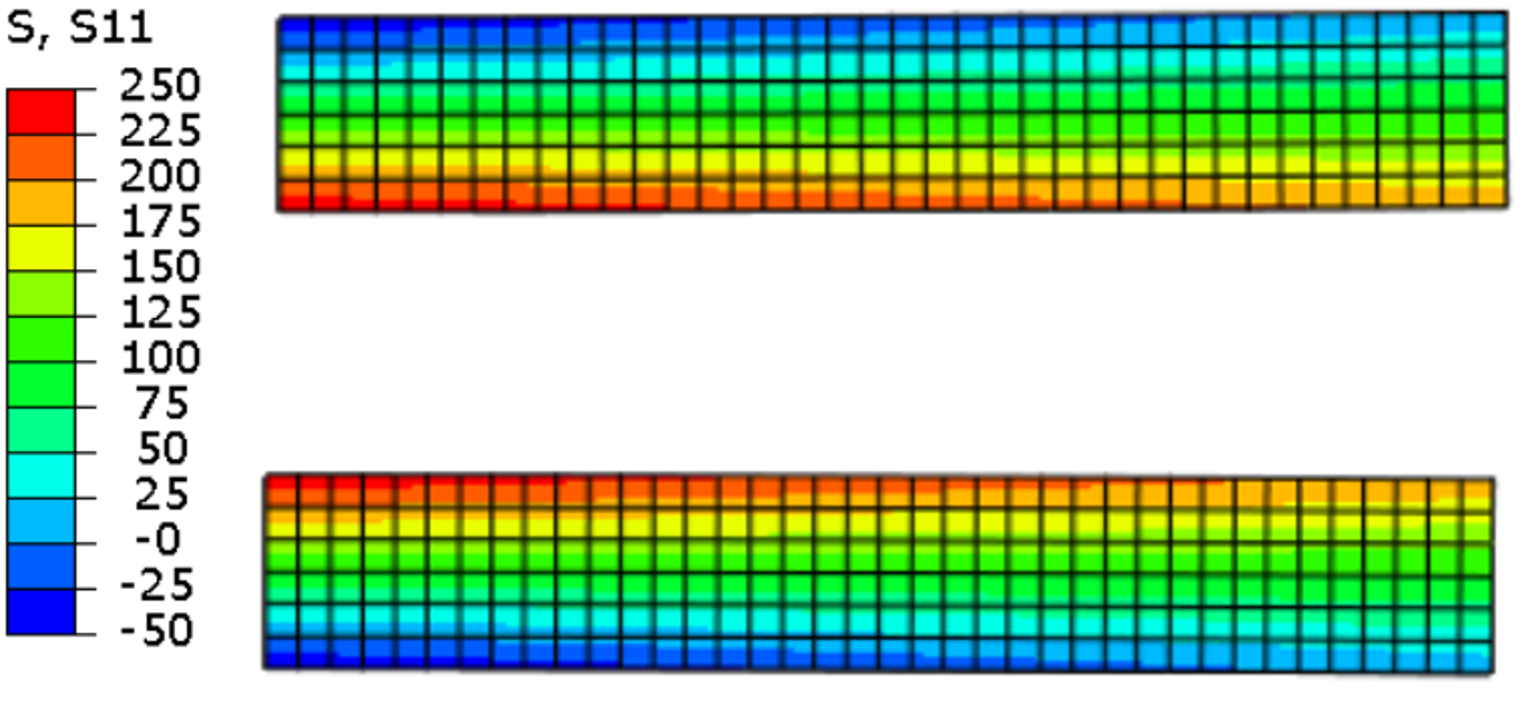
Step 2: As 1 plus bending load in positive Y-direction, load case “Up”
Step 3: As 1 plus bending load in negative Y-direction, load case “Down”
In this simple example, you can manually determine some values to evaluate the fatigue strength.
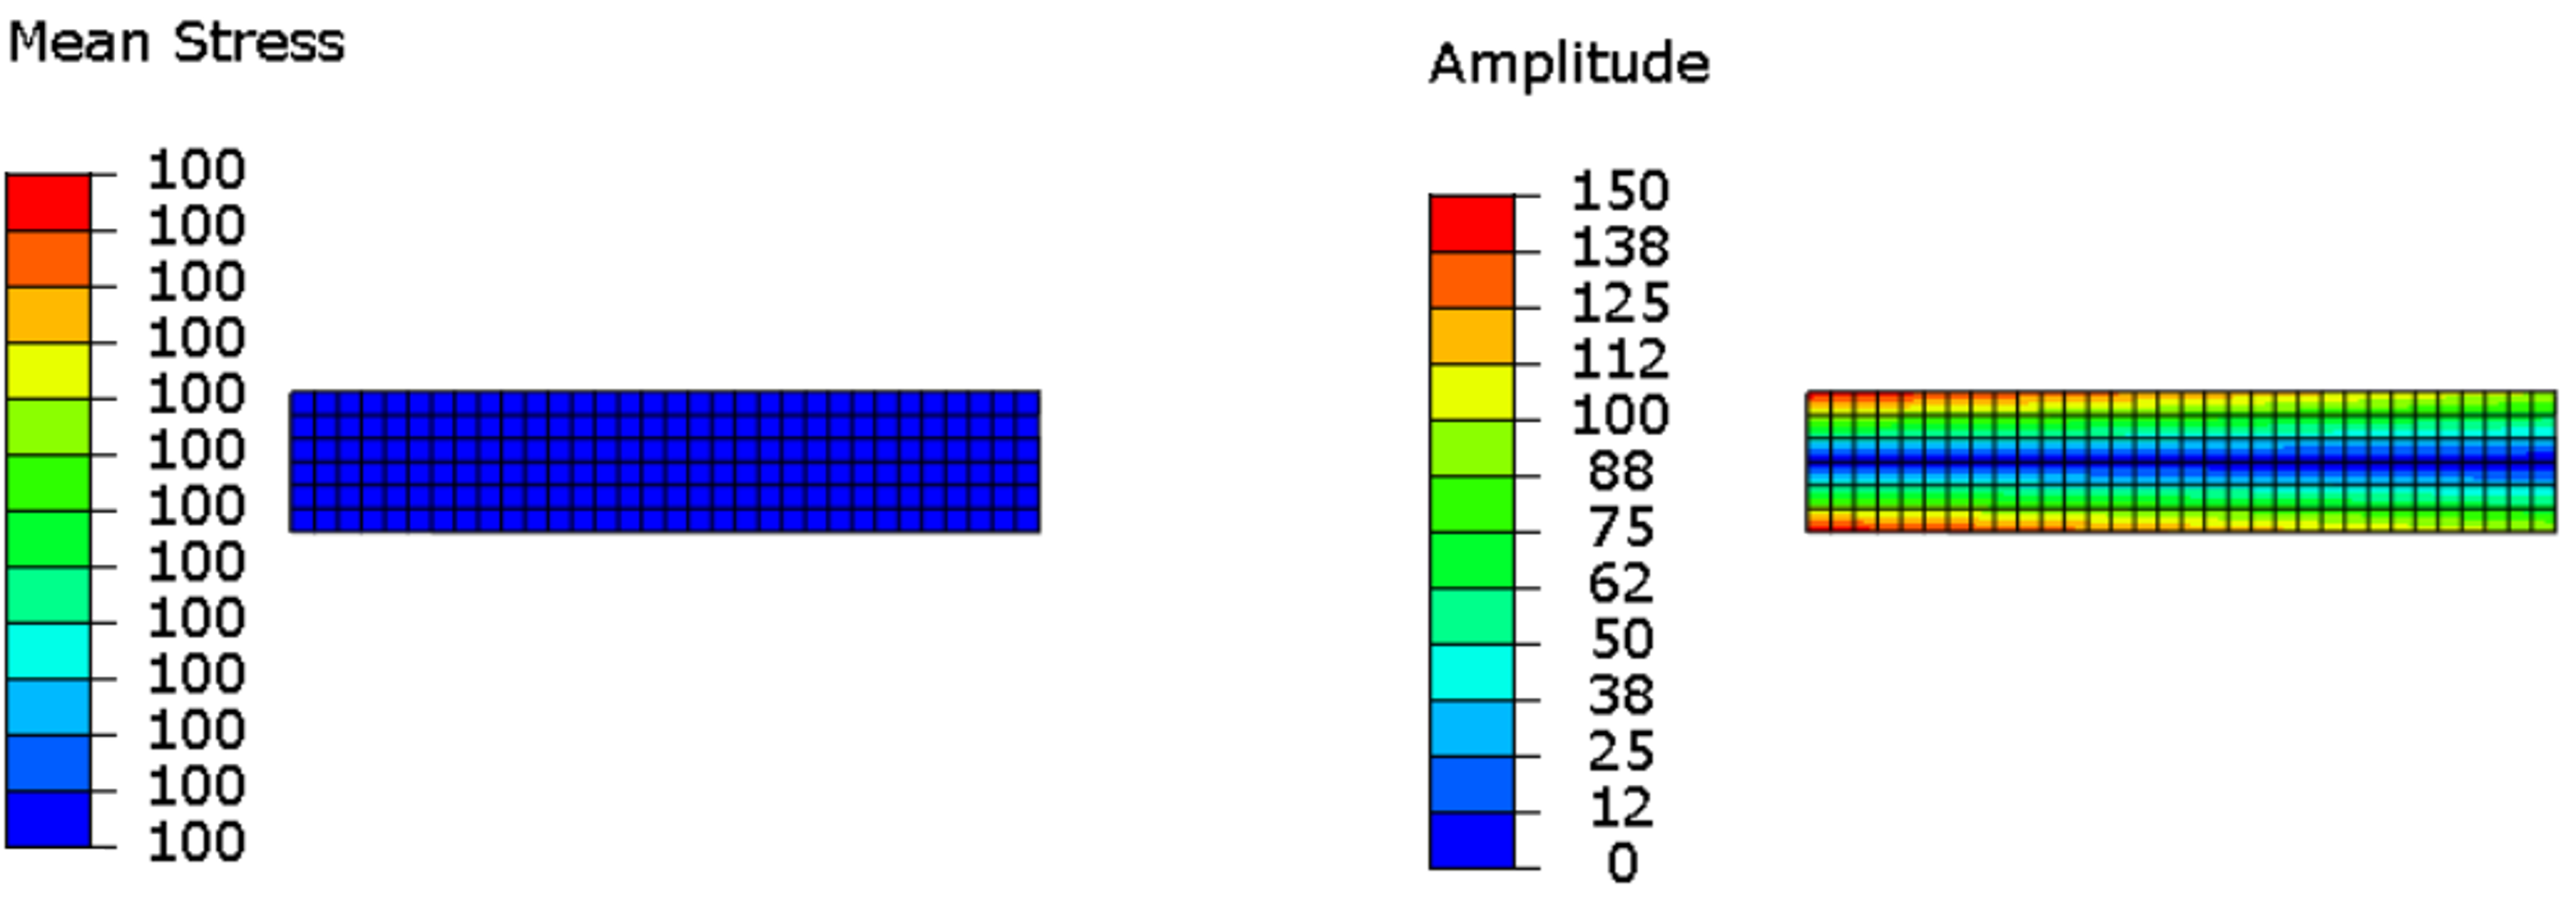
This results in an additional bending stress of 150 MPa. The maximum upper stress Smax is 250 MPa. The minimum stress Smin is -50 MPa. Thus, the mean stress is: (Smax+Smin)/2= 100 MPa and the amplitude is ABS(Smax-Smin)/2= 150 MPa.
We will now show how to determine these values in Abaqus/CAE via the calculation with frames.
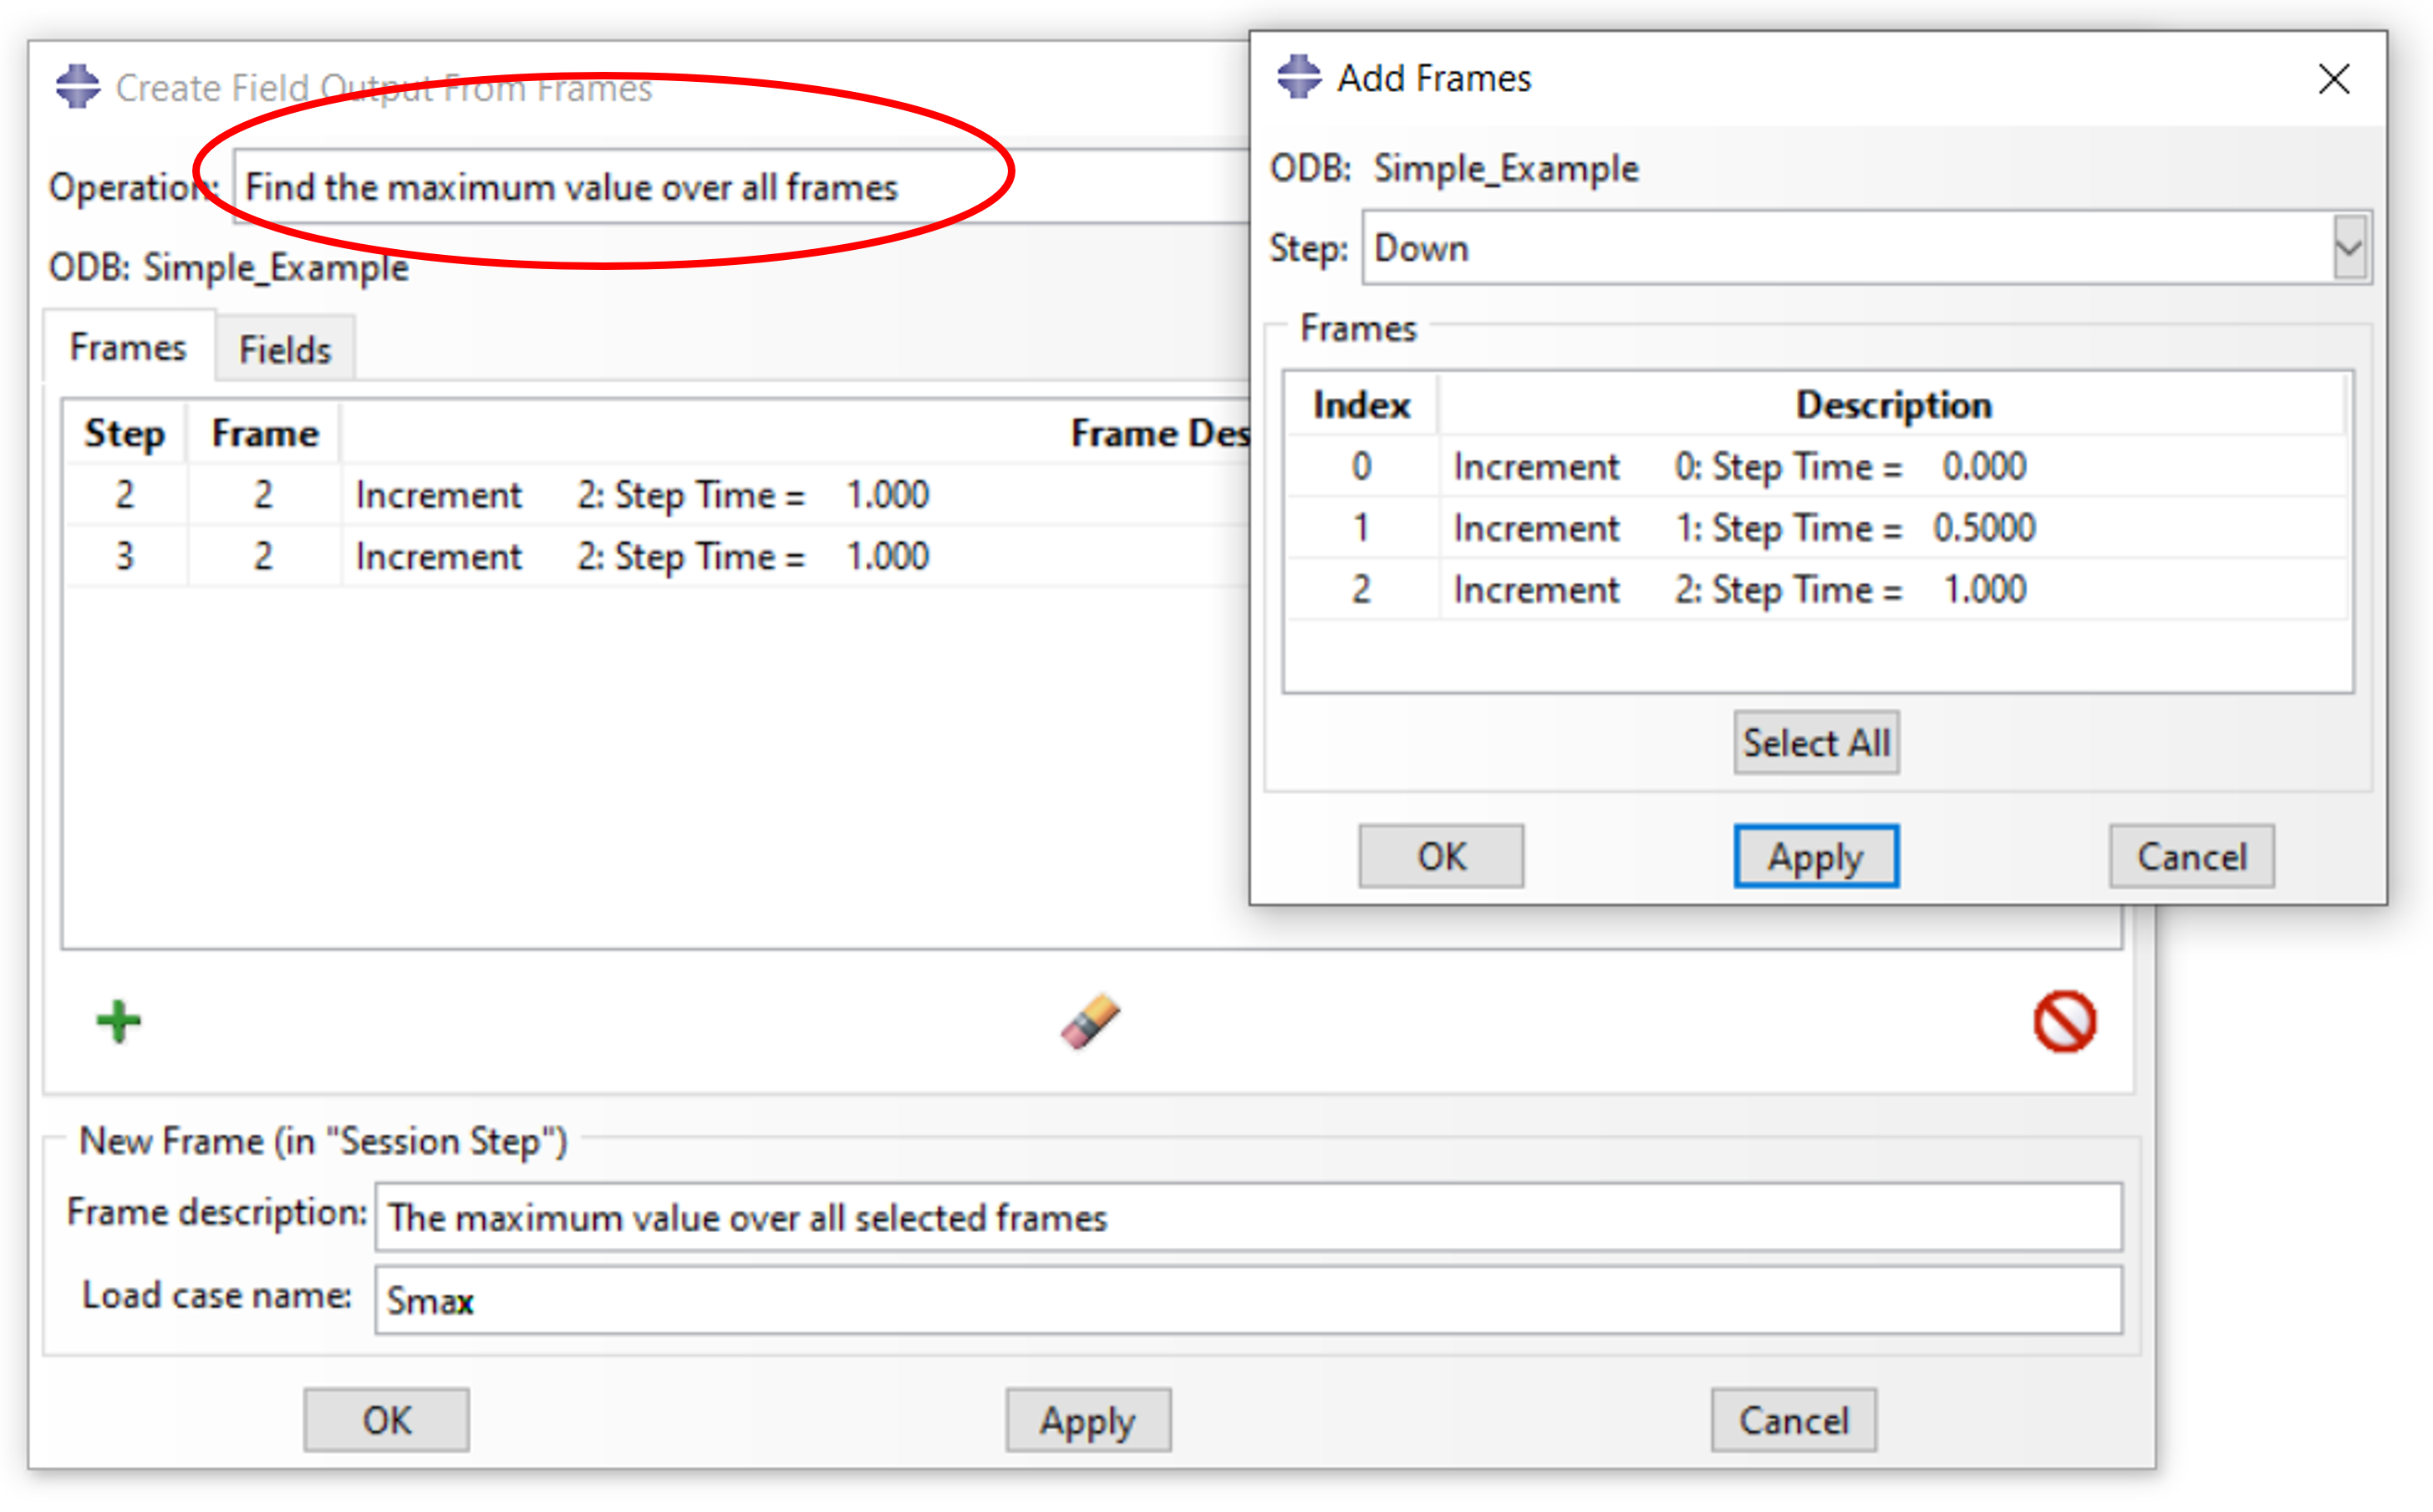
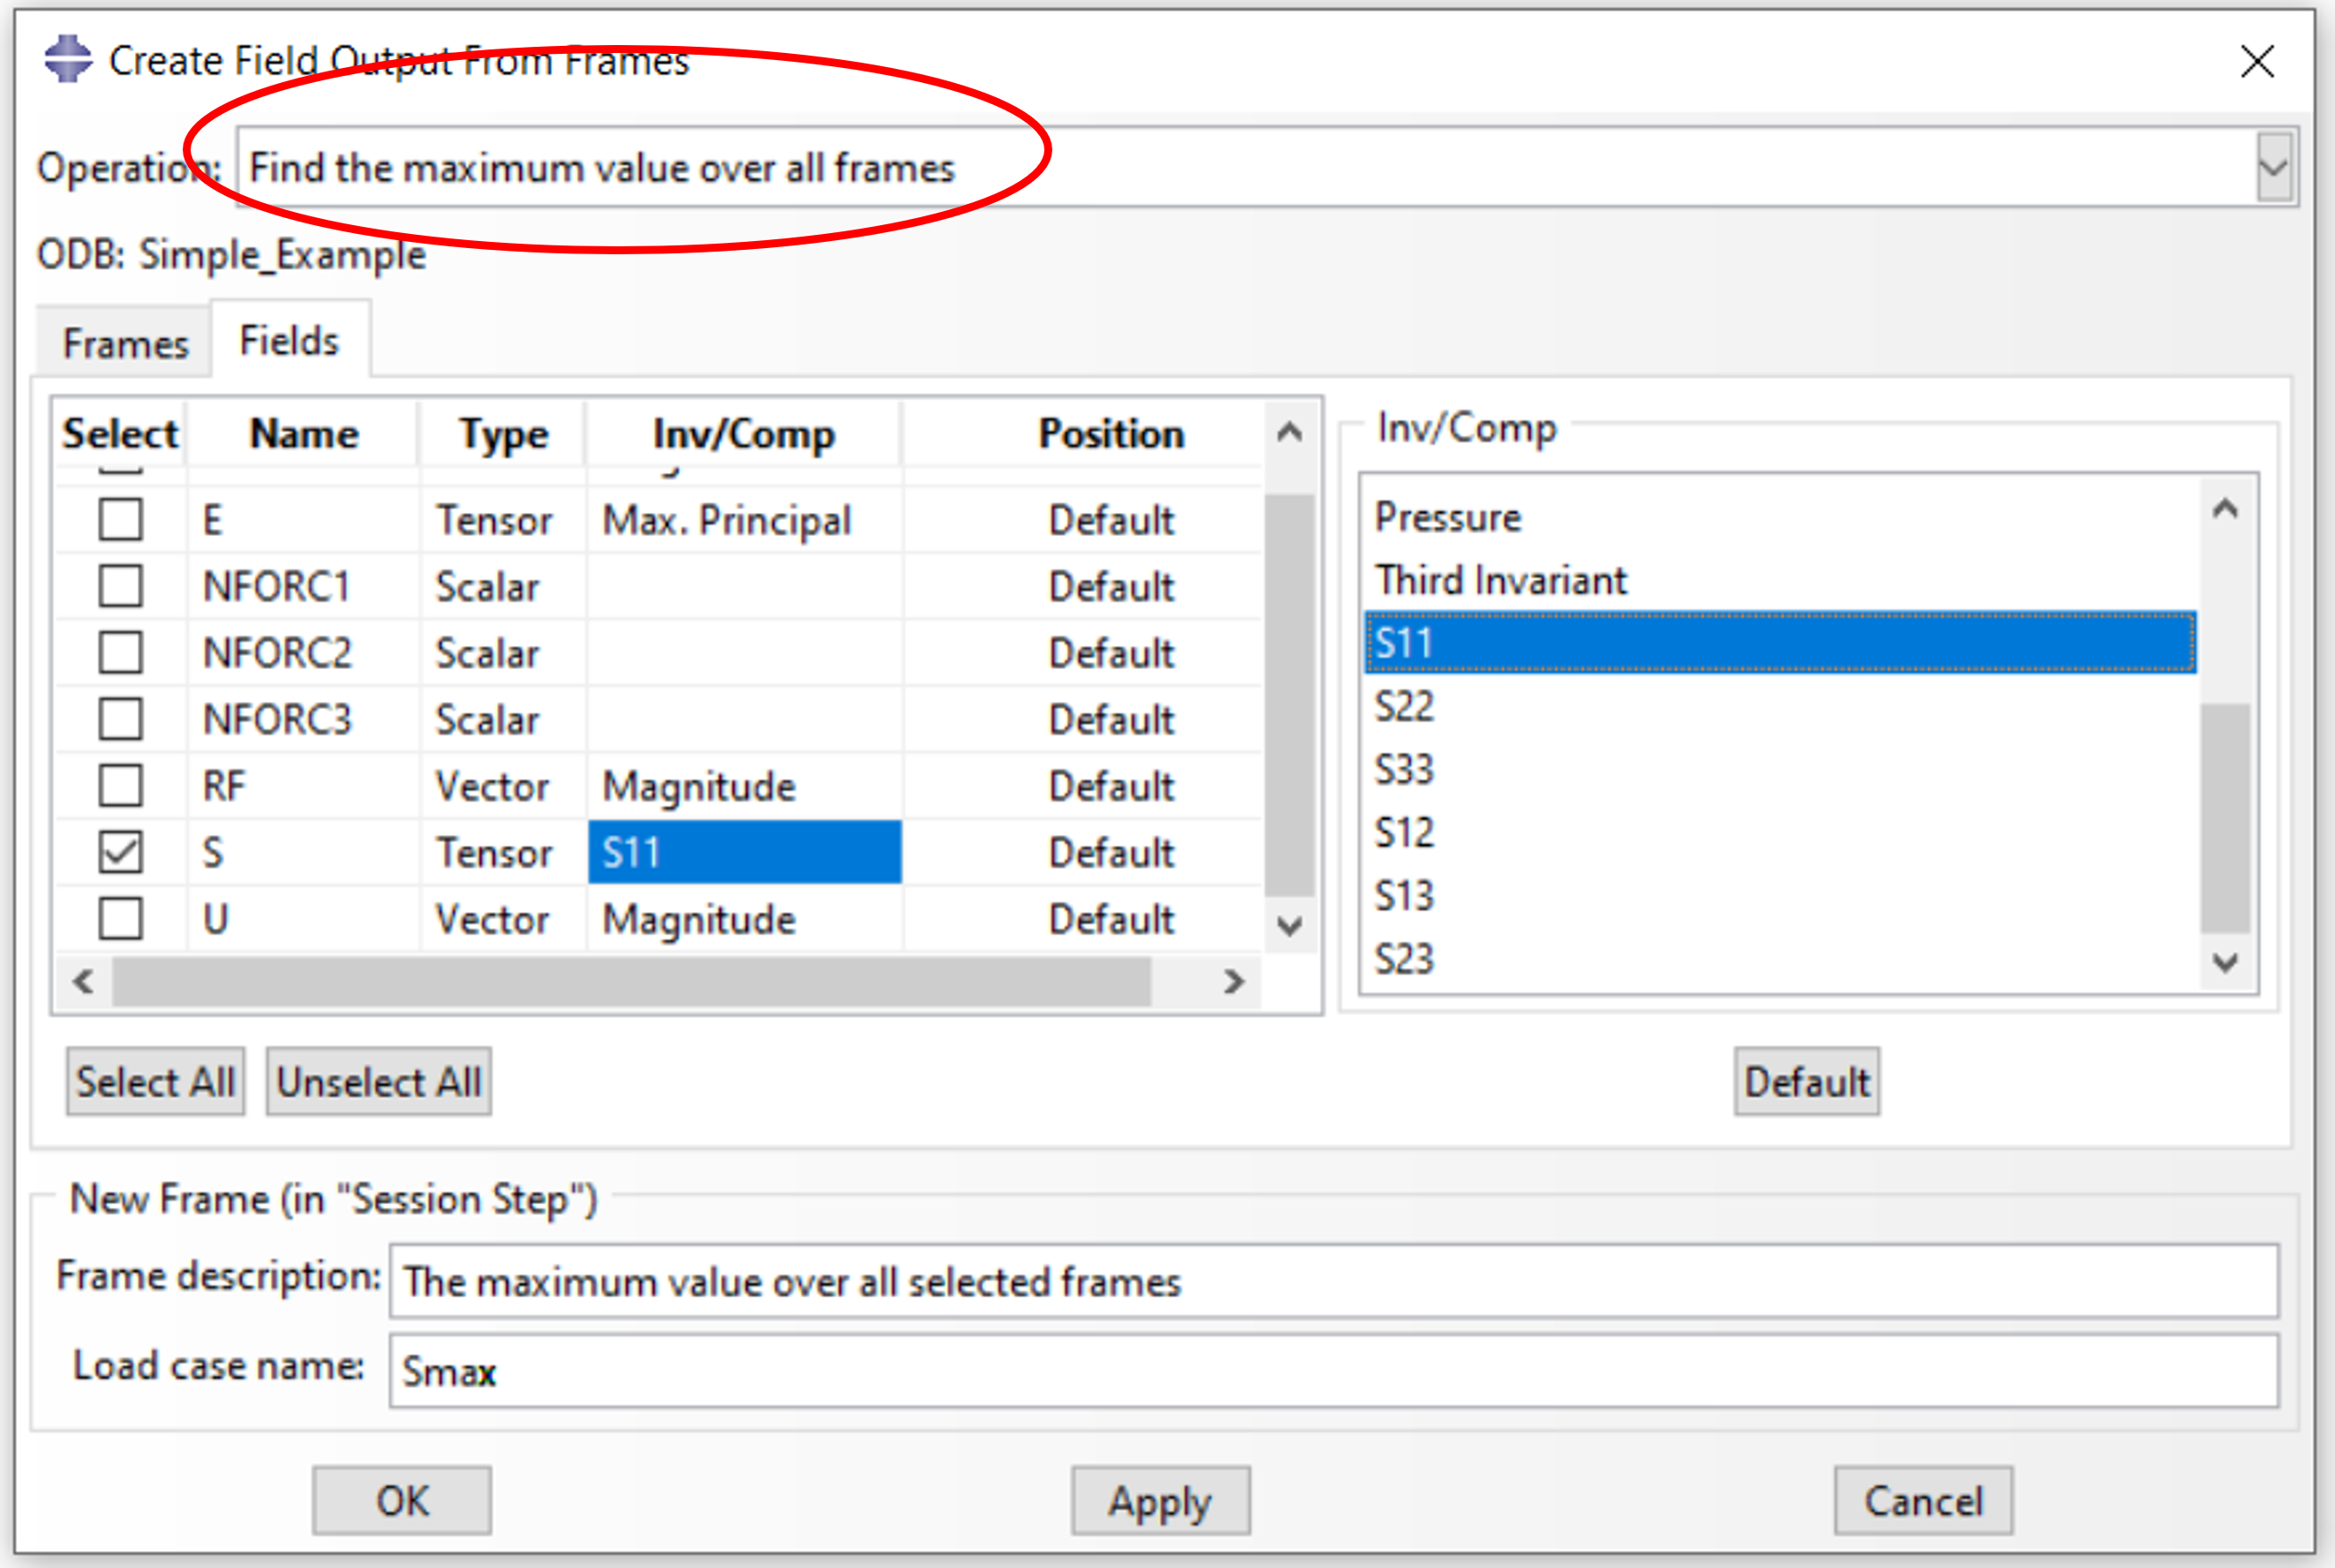
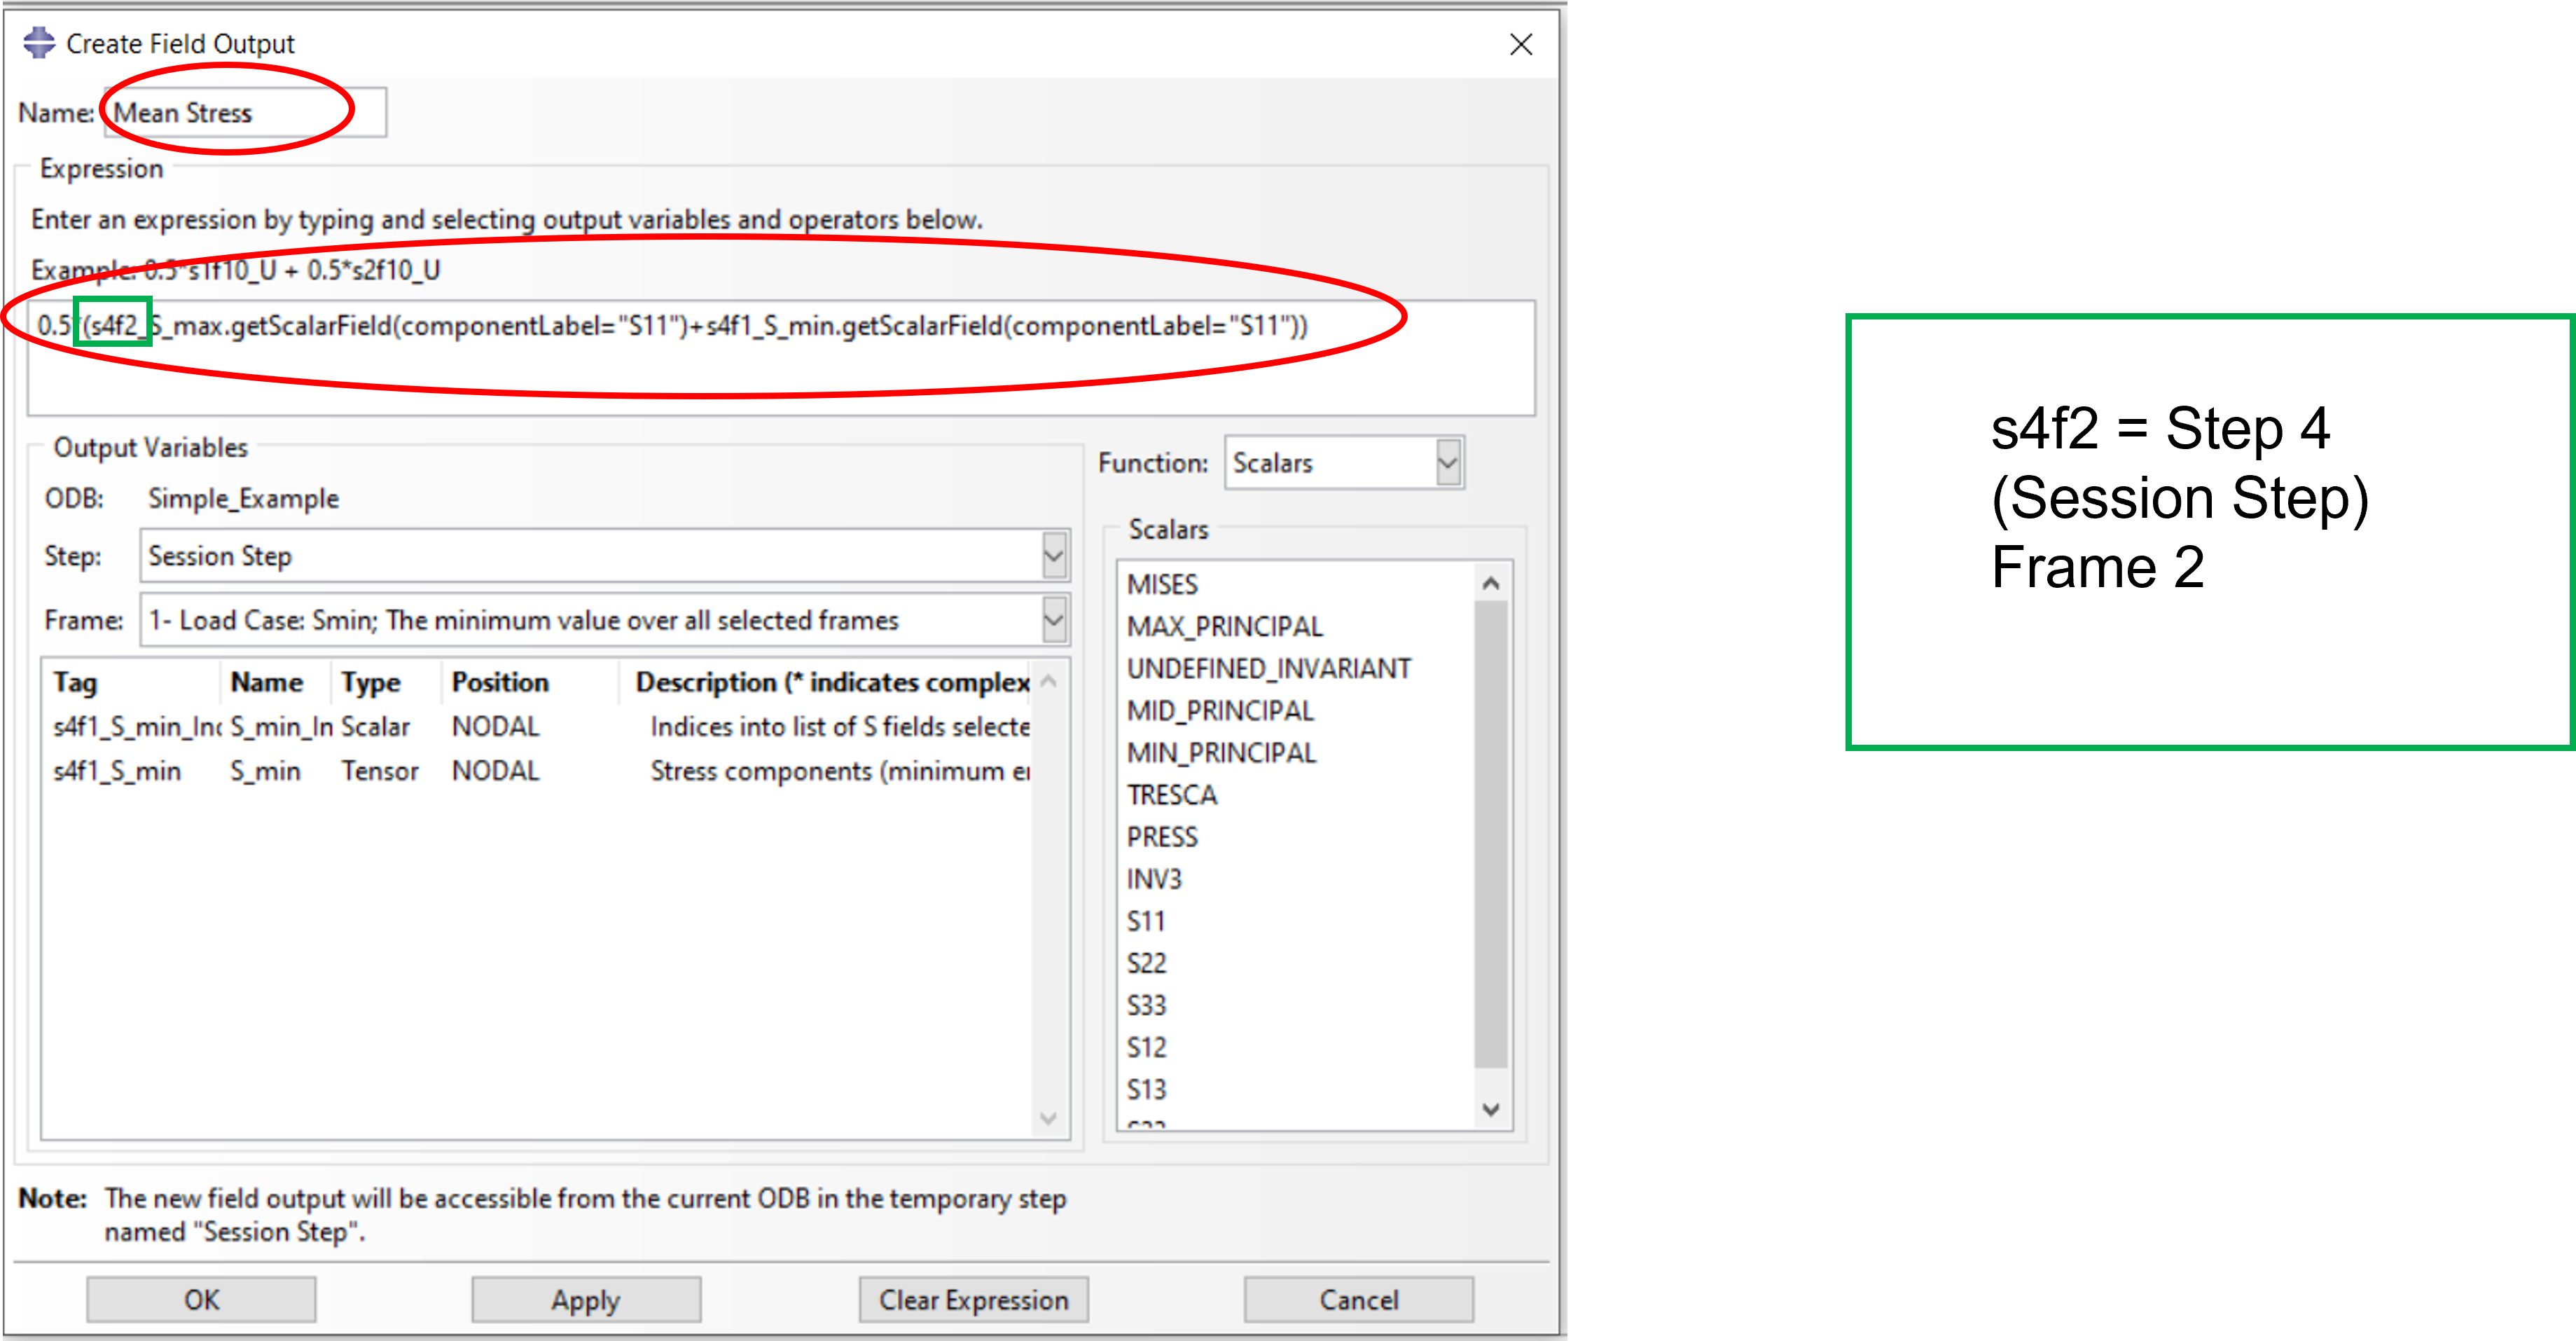
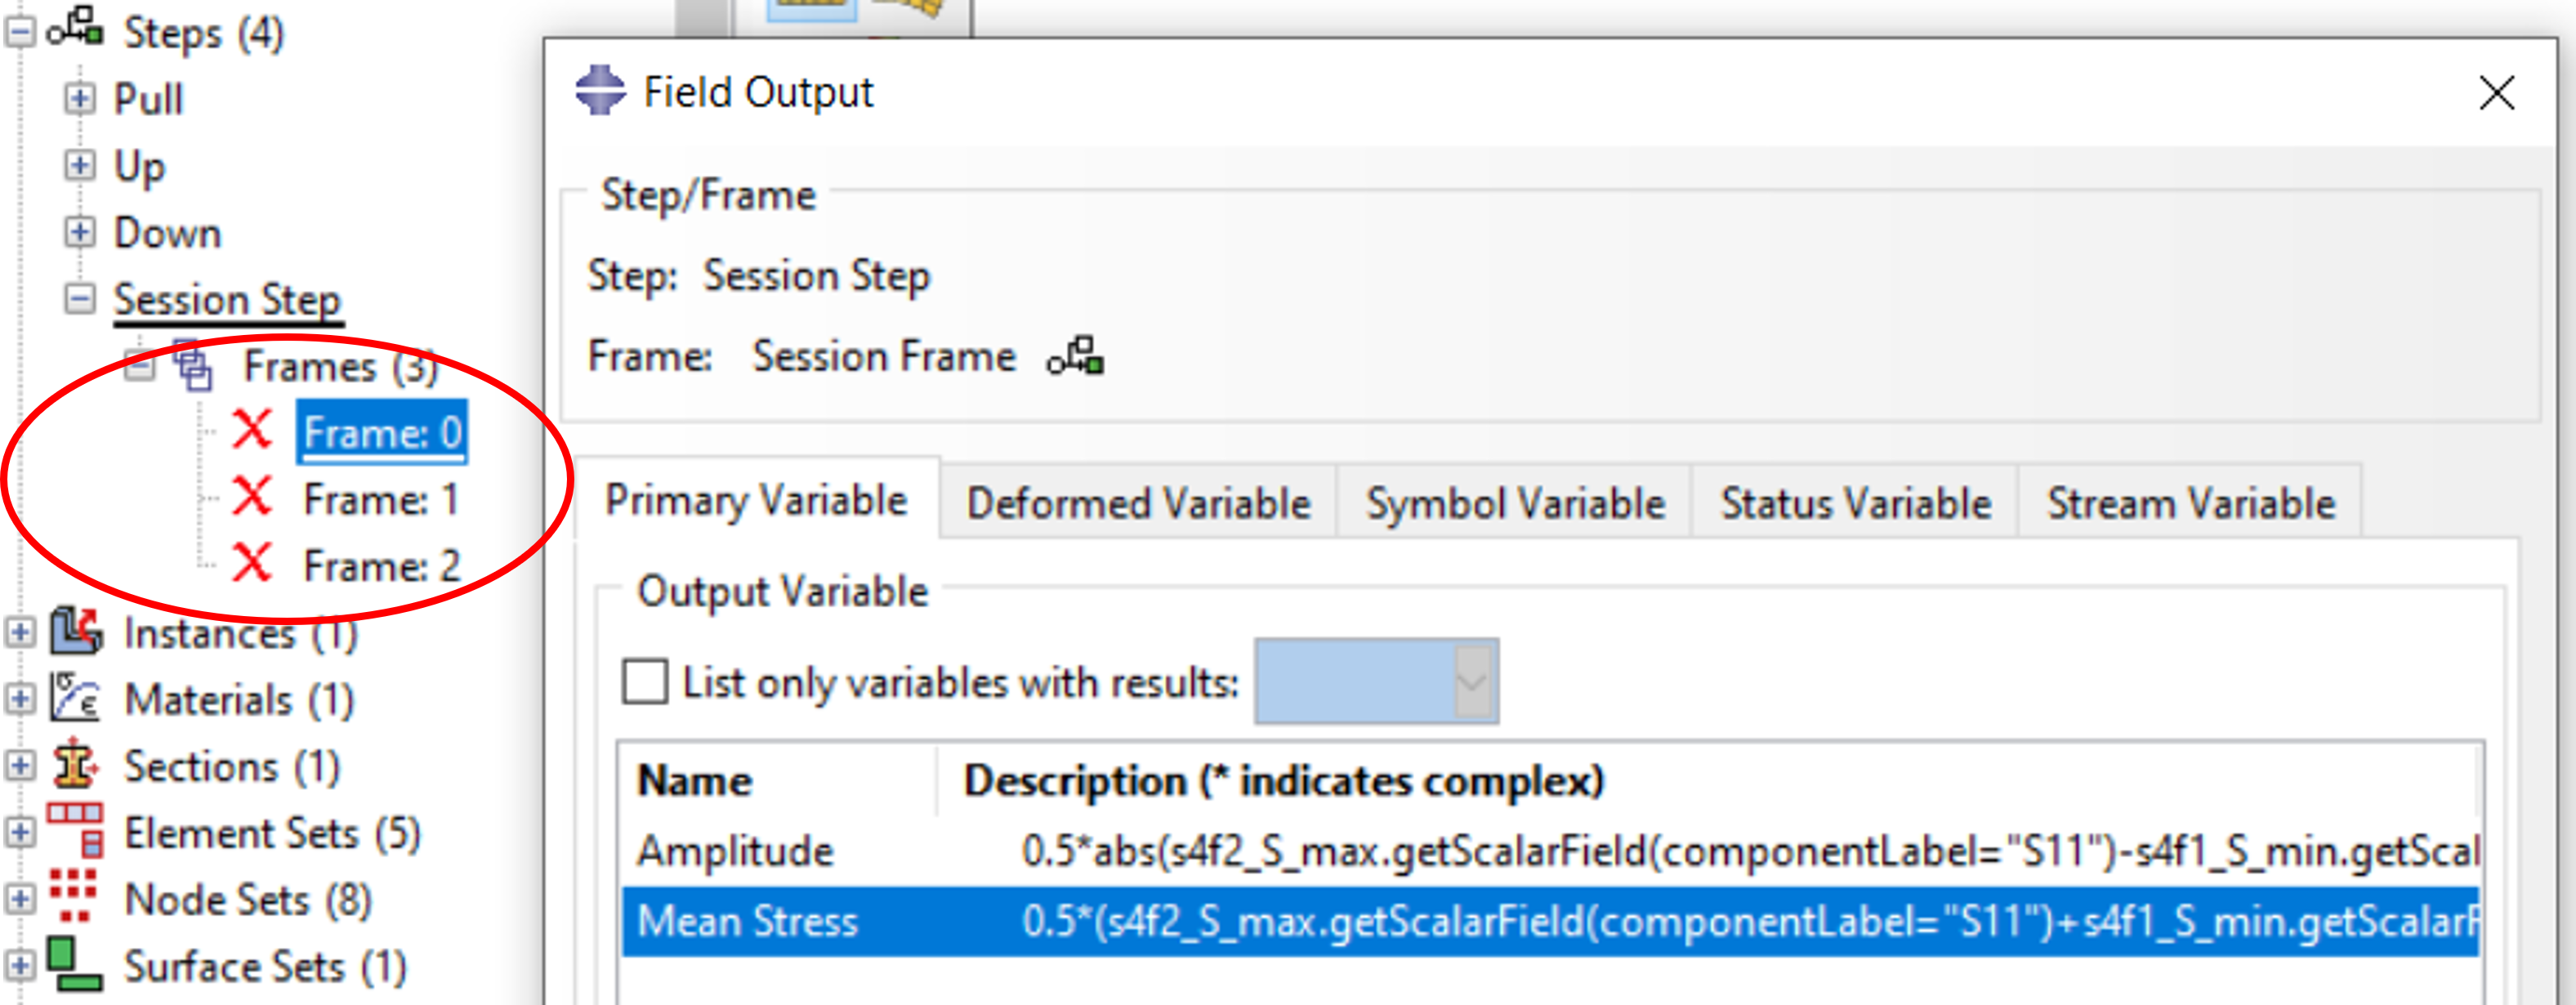
Now, we generate the calculation and field putput of the mean stress and amplitude from different frames.
Step 1: Generate output values via frames of the steps
Determination of the load via fatigue strength diagram (here: Smith diagram)
Red: material fatigue strength
Green: Reduced fatigue strength (material fatigue strength reduced by technological size factor and roughness factor).
The method shown here refers to uniaxial loading and does not claim to be a general procedure for fatigue strength verification.
Rather, it is intended to clarify the generation of output values via frames and fields and to demonstrate a pragmatic method for rapid estimation of component fatigue strength.

